Skip to content

The SomaFocus Technology

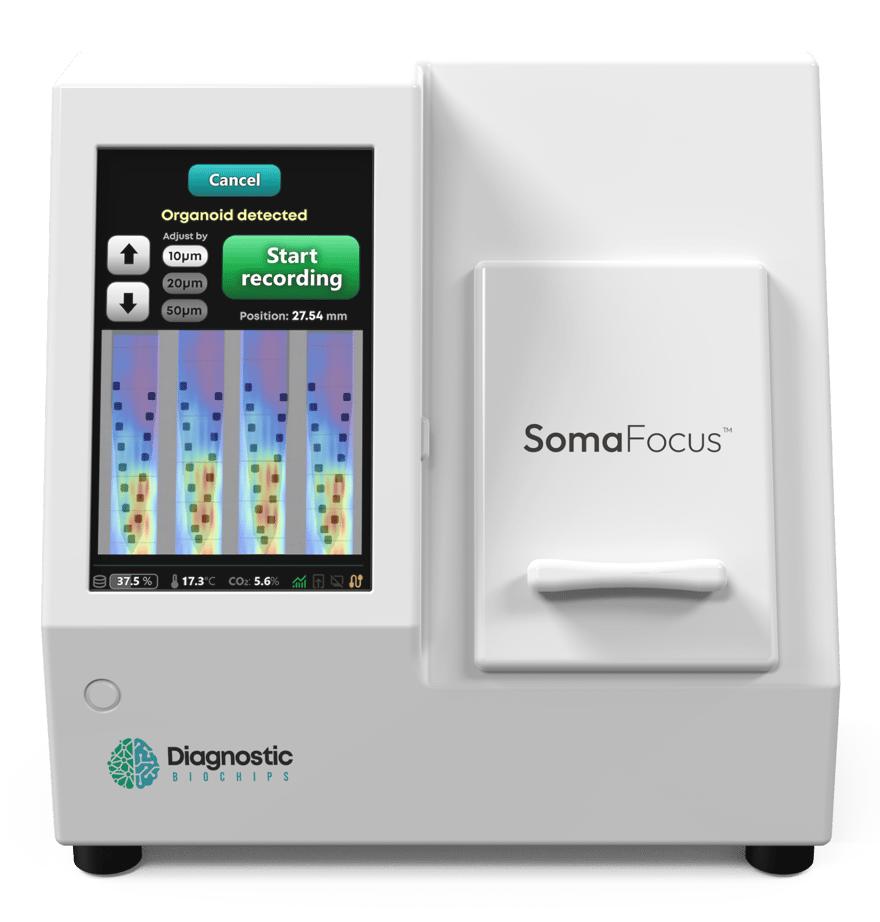
UI3_DBC-SOMAFOCUS-RENDER-FRONT-3
Reveal how neurons interact, communicate, and form circuits inside brain organoids
A Symphony by Ventral Forebrain Organoids: Real-time spike features encoded in C-major. Excitatory neurons and inhibitory neurons are represented by the red triangles and blue circles, respectively. The shape size corresponds to spike amplitude. Y-axis (pitch) = Spike Anatomical Depth, X-axis = Two-second rolling data over time. Note: You should see and hear a big synchronous event at around 20th second.
Expand Insights from 3D Models

Complement Imaging and Sequencing

Achieve Single-unit Resolution with Superior SNR

Automated, Plug-and-Play Workflow

Automated Data Acquisition

The SomaFocus platform combines semiconductor-grade sensing with automated data capture and streamlined analysis. Every experiment is processed as it runs, transforming complex electrophysiology signals into clear insights.

Real-time data captured as the probe advances through the organoid. Each channel line is spaced 20um vertically, with the bottom channel as the distal site and the top channel as the proximal site. 
Live Data Processing

Perform live processing of incoming data to reveal key metrics during each experiment. Visualize and interact with multiple data streams simultaneously, including:

- Spike detection and burst identification
- Local Field Potentials (LFPs) and synchrony detection
- Raw vs. filtered signal overlays
- Spike raster plots for population-level activity

All visualizations update continuously as recordings unfold, providing an immediate understanding of organoid network function.

Publication Ready Exports and Cloud-based Data Storage

Each recording session automatically generates organized output files, ready for downstream analysis in external toolchains such as Kilosort or custom pipelines. Secure cloud storage, enabling cross-site studies and team-based analysis. 

Probe Shank Displays

Explore a powerful visual interface for interpreting spatial patterns of activity across each probe shank. Translate complex multi-channel data into intuitive heatmaps that reveal how signals evolve in space and time.

Heat map representing microelectrode channels in organoid layer with active neurons. Bright burst of light corresponds to burst of synchronous electrical activity of neurons.
Headline Placeholder for Prod Video
WHAT SCIENTISTS ARE SAYING:
Single-cell sequencing is very expensive, so you don’t get a lot of samples. Imaging also has variability issues within organoids. That’s why a direct functional readout is really valuable. We tried MEA, but the 3D structure dissolves — cells just migrate out. It’s inconsistent and not really viable. That’s where DBC has a great advantage. SomaFocus is great because you can get a spatial orientation of where the cells are. With MEA, you don’t really get that same resolution.
Brady Maher, PhD, Lead Investigator- Lieber Institute, Developmental Neurobiology and Functional Genomics Division; Associate Professor- Johns Hopkins University School of Medicine, Department of Psychiatry and Behavioral Sciences and the Solomon H. Snyder Department of Neuroscience
SomaFocus Contact Form